
In this guide, we’ll break down the essentials of balance sheets and income statements, helping you understand what they tell you about a company’s financial standing and performance over time.
Understanding the Balance Sheet
The balance sheet provides a snapshot of a company’s financial health at a specific point in time. It shows what the company owns, what it owes, and how much value it holds for shareholders. Essentially, the balance sheet is divided into three key parts: assets, liabilities, and shareholders’ equity.
Assets are what the company owns and can use to generate revenue. Assets include cash, inventory, property, and equipment. Assets are classified as either current (short-term, like cash and inventory) or non-current (long-term, like buildings and machinery).
Liabilities refer to the company’s debts and obligations. Just like assets, liabilities can be current (like accounts payable, due within the next year) or long-term (like loans or bonds payable).
Shareholders’ Equity represents the company's net worth—the difference between total assets and total liabilities. It reflects the value that would be returned to shareholders if the company liquidated its assets and paid off its debts.
Key Metrics to Focus On
Liquidity
It measures how well a company can meet its short-term obligations. The current ratio (current assets divided by current liabilities) is a good indicator of whether a company can comfortably cover its debts with its available assets.
Debt Levels
A company with high debt may struggle during economic downturns. The debt-to-equity ratio (total liabilities divided by shareholders’ equity) helps you see how much of the company’s operations are financed by debt compared to equity. A balanced ratio shows financial stability, while an excessively high ratio may indicate too much risk.
The balance sheet gives you a snapshot of a company’s financial strength, showing whether it has the resources to handle both short-term and long-term obligations.
Analyzing the Income Statement
The income statement, often referred to as the profit and loss statement, is where you’ll find a company’s profitability story. Unlike the balance sheet, which provides a snapshot at a given moment, the income statement shows how the company has performed over a specific period—whether that’s a quarter or a full year. This is where you can see how much revenue the company earned, what its expenses were, and, most importantly, how much profit it made.
Key Metrics to Focus On
Revenue Growth
Revenue is the total income a company earns from its operations. A consistent upward trend in revenue indicates that the company is growing and successfully increasing sales. Flat or declining revenue could be a red flag that the company is facing challenges.
Profit Margins
There are several types of profit margins, but the two most important ones to analyze are:
Gross Profit Margin
This shows how efficiently a company is producing its goods or services by subtracting the cost of goods sold (COGS) from total revenue. The formula is:
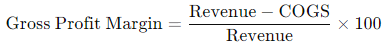
A higher margin means the company is keeping more profit from each dollar of sales.
Net Profit Margin
This looks at the company’s overall profitability, factoring in all expenses, including taxes and interest.
The formula is:
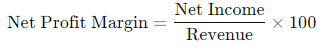
This ratio reveals how much of each dollar earned turns into profit after all costs are accounted for.
EBITDA (Earnings Before Interest, Taxes, Depreciation, and Amortization)
This metric gives a clearer picture of a company’s operational performance by removing factors like financing and tax structures. EBITDA is often used to compare profitability between companies, especially those in different industries.
Horizontal and Vertical Analysis
- Horizontal Analysis involves comparing financial data over multiple periods to spot trends and growth patterns. For instance, if you notice that revenue has consistently grown quarter-over-quarter, it’s a good sign the company is expanding. However, if expenses are growing faster than revenue, it may indicate inefficiencies.
- Vertical Analysis presents each line item on the income statement as a percentage of total revenue. This helps you assess the relative weight of expenses and profits. For example, if operating expenses consistently account for a high percentage of revenue, it might indicate a problem with cost management.
Focusing on these metrics can help you better understand a company’s ability to generate revenue and control expenses, giving you a clearer picture of its overall financial performance.
Comparative Analysis: Balance Sheet vs Income Statement
While both the balance sheet and the income statement are essential for understanding a company’s financial health, they serve different purposes and offer unique insights. Together, they provide a more complete picture of the company’s financial situation.
Balance Sheet is a snapshot of the company’s financial position at a specific point in time. It highlights what the company owns (assets), what it owes (liabilities), and what’s left for shareholders (equity). The balance sheet is primarily used to assess financial stability and liquidity.
In contrast, the income statement provides a view of the company’s operational performance over a period of time. It tracks the flow of revenue and expenses, showing whether the company is making a profit and how efficiently it is managing its operations.
The balance sheet helps you understand the company’s financial stability and its ability to meet both short-term and long-term obligations. The income statement, on the other hand, shows how well the company is performing on a day-to-day basis, indicating profitability and operational efficiency.
For example, a company might show strong profitability on its income statement but have significant debt on its balance sheet, which could be a cause for concern. On the flip side, a company with low profitability but a solid balance sheet may be financially stable but in need of operational improvements.
Both financial statements complement each other: the balance sheet gives a snapshot of financial strength, while the income statement reveals the company's ability to generate profit. It's crucial to review both to make well-informed investment or business decisions.
Conclusion
Analyzing a company’s balance sheet and income statement is essential for gaining a complete understanding of its financial health. By regularly reviewing these two key financial statements, alongside using horizontal and vertical analysis, you can spot trends, identify potential risks, and make more informed decisions.
Together, these tools form the foundation of sound financial analysis, equipping you to better understand a company's strengths and weaknesses. Use these insights to make smarter, data-driven decisions that support your financial goals and long-term success.